Límite diario gratuito alcanzado. Si quieres seguir navegando, ¡SUSCRÍBETE!
Más de 1 millón de inversores ya confían en nosotros. Haz como ellos y replica nuestras rentabilidades o descubre con facilidad las mejores inversiones del futuro gracias a nuestras herramientas, recomendaciones y análisis de expertos
Mensual
Anual
-20%
Access
Información y datos para inversores autónomos exigentes
Access
-17%
24
29€€/mes
24
29€€/mes
Información y datos para inversores autónomos exigentes
Carteras de inversión para replicar (EE. UU., Europa, Asia)
Accede a las decisiones de inversión concretas que nos han hecho famosos.
Sigue con total transparencia nuestras posiciones y los resultados de nuestras tres carteras: Europa, EE. UU. y Asia. Nuestras rentabilidades son reales, netas de comisiones de intermediación e impuestos sobre las transacciones.
Nuestras carteras se componen de empresas líquidas.
Los valores están diversificados por países/sectores para reducir el riesgo.
Recibirás una alerta cada vez que realicemos una operación.
En promedio realizamos dos operaciones por mes y por cartera.
*Las rentabilidades pasadas no garantizan rentabilidades futuras.
Una base de datos mundial sin igual
Nuestra base de datos es la referencia de los inversores más exigentes. Se nutre de las mejores fuentes y abarca todos los mercados e instrumentos de inversión cotizados. Tanto si la utilizas para seguir la evolución de tu cartera o de un sector como para descubrir oportunidades, nuestra plataforma te ofrece una perspectiva completa desde un solo lugar.
Medio de comunicación de referencia con una profundidad de la información sin igual
MarketScreener es el medio de comunicación de referencia para seguir los mercados financieros. Benefíciate de nuestra independencia y nuestra experiencia con una visión global, de 360 grados: acciones, ETF, sectores, economía, índices, divisas, criptomonedas, materias primas...
Utilizada por millones de inversores cada mes en más de 90 países, nuestra oferta de información goza de un reconocimiento mundial por su solidez, capacidad de respuesta, cobertura y valor añadido.
Adopta una perspectiva global con los artículos, análisis y perspectivas de inversión que elabora nuestro equipo de periodistas, analistas y científicos, expertos en los mercados financieros.
Sigue los mercados en tiempo real gracias a los flujos de información procedentes de las mejores fuentes del mundo, disponibles en siete idiomas y traducidos automáticamente para su lectura inmediata.
Accede a la base de datos más exhaustiva de internet. Utiliza nuestra amplísima información detallada para seguir tus valores y sectores favoritos o descubre nuevas empresas.
Lee los resúmenes de nuestros periodistas, que madrugan para mantenerte informado y ahorrarte tiempo.
Los expertos de MarketScreener producen análisis y recomendaciones a diario. Esto te permite descubrir o redescubrir empresas en que invertir o que te conviene evitar.
Redactados por nuestro equipo de expertos, nuestros artículos en profundidad te ayudarán a tomar tus decisiones y comprender las nuestras.
Seleccionamos empresas de calidad, es decir, negocios que están en crecimiento, generan beneficios sin depender excesivamente de la deuda, y que están valoradas a niveles razonables a la vista de sus ventajas competitivas. El tiempo juega a su favor.
Hacemos un seguimiento continuo de 70 temas de inversión de actualidad o que responden a tendencias estructurales.
Encuentra nuestras listas de valores en forma de carteras con su rentabilidad y sus exposiciones sectorial y geográfica. Cada tema se explica en detalle y las listas de empresas se actualizan con frecuencia.
Sigue tus valores o importa tu información, y gestiona de forma eficaz tus inversiones gracias a nuestras herramientas, bases de datos y noticias:
Crea hasta 10 listas de 50 valores para seguir a tus empresas favoritas: cotizaciones en tiempo real, información, publicación de resultados, evolución de las estimaciones, recomendaciones de los analistas…
Configura tus alertas y no te pierdas ninguna noticia.
Haz como los grandes inversores y los analistas profesionales, y conoce a fondo las empresas accediendo a las transcripciones de las publicaciones de resultados, las conferencias con inversores o las presentaciones de la empresa.
Cada transcripción se estructura y organiza para que puedas desplazarte con facilidad entre las declaraciones de los directivos y las preguntas de los analistas o los inversores.
Descubre también un análisis sobre la positividad del contenido y una clasificación de las palabras clave utilizadas.
Siempre actualizados e ideales para el análisis fundamental y la generación de ideas de inversión. Para su uso inmediato, en una reunión o en el marco de un comité de inversión, se pueden imprimir, compartir, almacenar y escribir sobre ellos.
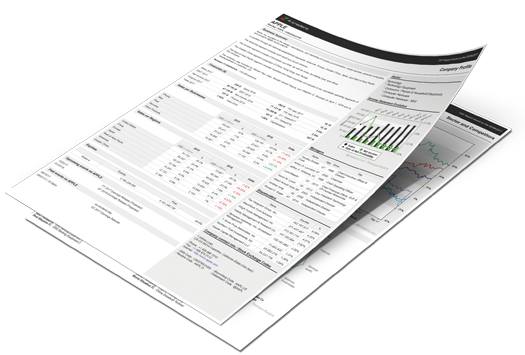
Descargables y disponibles para más de 60.000 empresas cotizadas, los informes resumidos de 6 páginas contienen toda la información detallada y ofrecen una visión completa de cada empresa:
La suscripción Access está dedicada a inversores autónomos exigentes que buscan información y datos.
Su suscripción a Access incluye muchas ventajas, entre ellas:
Una navegación ilimitada sin bloqueo de anuncios, con acceso completo e ilimitado a todas las noticias, artículos y análisis de MarketScreener.
Acceso gratuito a las newsletters diario (Morning Meeting) y semanal (El boletín semanal)
El acceso gratuito a todas nuestras guías de pago, que podrá descargar fácilmente desde su cuenta MarketScreener.
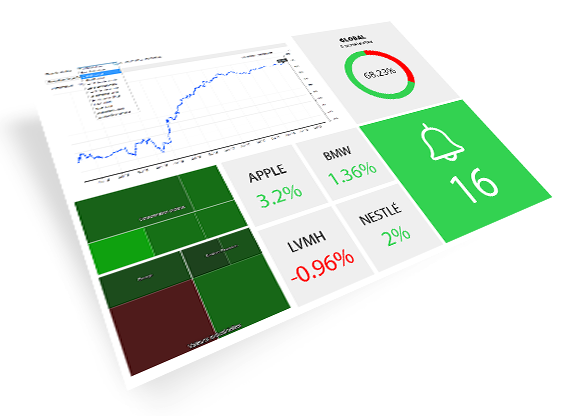
Acceso al Portfolio Manager.
Un servicio de atención al cliente para ayudarte y apoyarte
Acceso gratuito a la aplicación para iPhone de MarketScreener.
Acceso a muchas listas de inversión temáticas, listas de valores diseñadas específicamente para cada gestión o estilo de inversión (valores: crecimiento, descuento, dividendo, calidad, ESG, multibaggers, estrategia ofensiva, dinámica, etc.).
Acceso a más de 50 listas de valores clasificadas por sector de exposición o una temática concreta (solar, eólica, videojuegos y Esports, defensa, hidrógeno, internet, inteligencia artificial, robótica, comercio electrónico, fintechs, blockchain, metales estratégicos o raros, etc.)
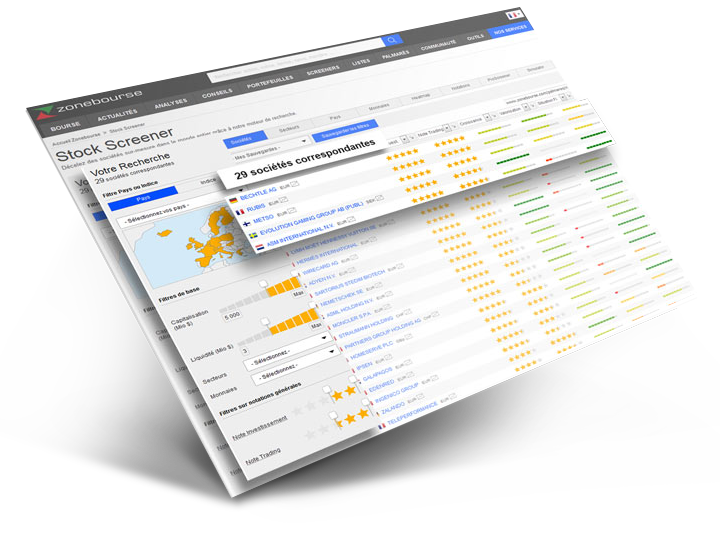
Acceso al Stock Screener más avanzado del mercado, podrá clasificar y comparar todas las empresas
Scoring exclusivo de las empresas (nota de inversión y nota de trading disponibles a través de nuestro Stock Screener) construido según numerosos criterios (crecimiento, valoración, revisión BNA a largo plazo, situación financiera, rentabilidad, publicación y visibilidad, revisión BNA a corto plazo, etc.) que permite a nuestros clientes identificar rápidamente aquellas que clasificamos según inversiones a largo o corto plazo.
Acceso a la generación automática de informes financieros en PDF sobre todas las empresas cotizadas a nivel mundial
Acceso ampliado a listas personalizadas (10 * 50 acciones)
Acceso ampliado a carteras virtuales (10 * 50 acciones)
Acceso a cientos de métricas fundamentales
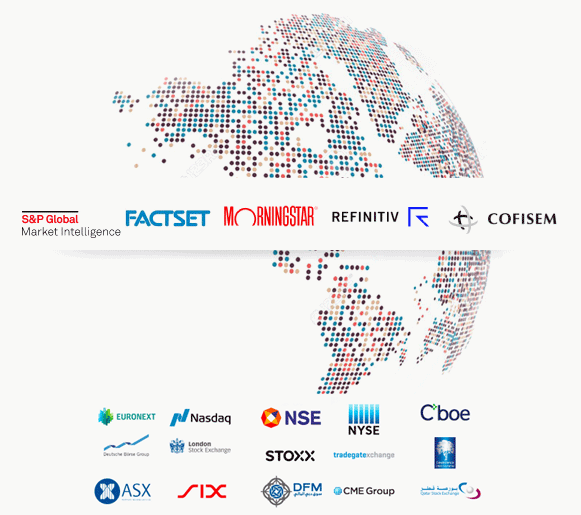
Datos fundamentales de calidad institucional, trabajamos con todos los proveedores de datos financieros y bursátiles más fiables y reconocidos del mundo (Refinitiv, S&P Global, MorningStar, Factset, etc.)
¿Qué está incluido en mi suscripción Premium ?
La suscripción Prémium es para los inversores que quieren conocer nuestras opiniones y decisiones para invertir en bolsa
Tu suscripción Prémium tiene muchas ventajas:
Todas las herramientas, servicios y contenidos de la suscripción Access
Acceso ilimitado a todos los consejos de nuestros expertos para que puedas optimizar la rentabilidad de tus inversiones
Acceso a las 3 carteras, Europa/EEUU/Asia, en las que realmente invertimos, para seguir y replicar nuestras inversiones y ayudarte a batir a los mercados
Acceso ilimitado al Stock Screener más avanzado del mercado, para clasificar y comparar todas las empresas
Acceso ilimitado a la generación automática de informes financieros en PDF de todas las empresas cotizadas del mundo
Acceso al Newsletter Premium
Esta gama de servicios te permite optimizar la rentabilidad de tus inversiones y batir a los mercados.
¿Qué está incluido en mi suscripción Expert ?
La suscripción Expert está dedicada a los inversores que buscan herramientas de toma de decisiones para expertos en inversión
Su suscripción Expert incluye muchas ventajas:
Una completa gama de herramientas, servicios y contenidos de la Suscripción Premium
Un coaching telefónico personalizado, en directo con nuestros expertos
Acceso a la versión Stock Screener Pro
Acceso al Evento Screener
Acceso ilimitado a la generación automática de informes financieros en PDF sobre todas las empresas que cotizan en bolsa a nivel mundial, así como la posibilidad de personalizar estas plantillas para los informes financieros
Acceso ampliado a listas personalizadas (50 * 500 valores)
Acceso ampliado a carteras virtuales (20 * 100 valores)
Este paquete le ayudará a alcanzar nuevas cimas en el rendimiento de sus inversiones y en el dominio y comprensión de los mercados bursátiles.
¿Qué justifica el precio de sus suscripciones?
MarketScreener ofrece precisamente la mejor relación cantidad, calidad y precio..
Otras empresas pueden ofrecer suscripciones más baratas, pero ninguna ofrece un servicio tan completo de información, herramientas, análisis, asesoramiento, carteras realmente invertidas, etc, como MarketScreener.
MarketScreener ofrece el servicio más completo para invertir en bolsa.
Todas las noticias bursátiles del mundo en directo
Contenido exclusivo MarketScreener de alto valor añadido que incluye nuestros análisis y consejos de inversión
Una base de datos sin parangón que cubre el +99,9% de las empresas cotizadas en todo el mundo
Las Mejores herramientas bursátiles de análisis y selección de valores, que ofrecen un completo panel para invertir en bolsa
3 carteras de la UE, EE.UU. y Asia realmente invertidas para permitirle replicar nuestras inversiones y niveles de rendimiento que superan a los mercados globales
Formación para ayudarte a progresar y entender mejor los mercados
La aplicación bursátil más completa del mercado
MarketScreener proporciona a los usuarios datos claros, fáciles de usar, de calidad y en profundidad para que pueda superar al mercado y convertirse en el tipo de inversor que desea ser.
¿Cómo consiguen ofrecer tantas herramientas y contenidos de calidad?
Todos los inversores merecen beneficiarse de una información de calidad basada en datos fiables. Como existimos desde 2001, hemos dedicado los últimos 20 años a crear las herramientas que necesitamos para gestionar, supervisar y analizar los mercados y hacer crecer nuestras carteras. Por eso nuestras herramientas son tan útiles y eficaces, porque tienen su origen en las necesidades concretas de todo inversor sensato.
En cuanto a la calidad de nuestros contenidos, hemos creado y ampliado nuestros equipos de analistas y periodistas para ofrecer diariamente a nuestros clientes contenidos exclusivos de alta calidad. En MarketScreener no hay ni un solo miembro del equipo que no sea experto en su campo.
¿Podré acceder a MarketScreener desde varias plataformas?
Sí. Puede acceder a MarketScreener.com a través de el sitio móvil y el sitio de escritorio, así como la aplicación móvil para iOS (gratuito con la fórmula Access).
Con una sola suscripción, ¿puedo acceder a todas las ediciones (FR, US, ES, etc.)?
Cada edición de nuestros productos se considera un sitio en sí mismo, con sus propios contenidos exclusivos, noticias adaptadas, destacadas (cotizaciones, mercados, etc.) adaptados a cada edición. No obstante, ofrecemos a todos nuestros miembros la posibilidad de acceder a todas nuestras ediciones iniciando sesión con el nombre de usuario y la contraseña de su edición original.
¿Cuántas acciones, índices y cotizaciones cubren?
Acceda a la oferta de información financiera y bursátil más completa que cubre más del 99,9% de las empresas cotizadas del mundo.
Nuestros sistemas de calificación y análisis, tanto técnicos como fundamentales, se actualizan diariamente en casi 20.000 empresas..
También cubrimos cerca de 10.000 ETFs y más de 280.000 índices, y todo tipo de cotizaciones (divisas, criptomonedas, materias primas, ...etc.).
¿Quién es su proveedor de datos?
Trabajamos con todos los proveedores de datos financieros y bursátiles más fiables y reconocidos del mundo, como Refinitiv, S&P Global, MorningStar, FactSet y muchos otros.
¿Qué debo hacer si tengo problemas con mi suscripción?
Puede ponerse en contacto con nosotros en cualquier momento. Nuestro servicio de atención al cliente está disponible en horario comercial para responder a todas sus preguntas. Está formado por personas reales y expertos que le ayudarán a utilizar nuestro sitio para optimizar el rendimiento de sus inversiones.
¿Qué pasa si quiero cancelar mi suscripción?
Si desea cancelar su suscripción a MarketScreener, puede hacerlo en cualquier momento, muy fácil y rápidamente a través del botón "cancelar" disponible desde "mi cuenta" > "mis suscripciones".
¿Qué métodos de pago aceptan?
Actualmente aceptamos cualquier tarjeta de crédito o débito como MasterCard, Visa, American Express, Gpay, Apple pay. También aceptamos PayPal. Todos los pagos se procesan de forma segura a través de Stripe o Paypal.
¿Qué suscripción me da acceso a las transcripciones?
MarketScreener, como medio de comunicación especializado en noticias bursátiles, da acceso a muchos tipos diferentes de contenidos (artículos, análisis, vídeos, formación, transcripts, etc.). Con una simple suscripción Access podrá acceder a todas los transcripts disponibles en nuestro sitio.
Los Transcripts, una herramienta esencial para el inversor informado, le permitirán completar el análisis en profundidad de una empresa más allá de su cuenta de resultados.
¿Cómo recibir alertas por SMS / correo electrónico?
Varias alertas (correo electrónico/sms) disponibles en función de tu nivel de suscripción
Seguimiento prémium : Todos los lunes por la tarde, recibe la útlimas noticias de nuestras tres carteras reales
Cartera Inversor Europa/Estados Unidos/Asia: Alertas en tiempo real de nuestras posiciones, por correo electrónico (por defecto) y SMS (opcional)
El boletín semanal de MarketScreener : Cada viernes por la tarde, recibe el informe semanal de los diferentes activos cotizados.
Morning Meeting: Recibe todas las mañanas la evolución de los mercados financieros y los valores a seguir
El comentario mensual de Europa One : Recibe todos los meses el comentario de gestión del fondo Europa One, gestionado con el asesoramiento exclusivo de MarketScreener.
Alertas sobre análisis de productos derivados : Recibe en directo todas nuestras recomendaciones sobre Turbos y Warrants
Listas de valores : Alertas por correo electrónico (alertas sobre sus listas de valores registradas)
Si finaliza mi suscripción, ¿perderé mis datos/listas/carteras?
En caso de suscripción expirada perderá el acceso a las herramientas y servicios vinculados a su fórmula de suscripción. No obstante sus listas, carteras...etc. no se eliminan y puede volver a acceder en cualquier momento con una suscripción activa.
¿Cómo eliminar mi cuenta?
Porque el control y la gestión de sus datos personales es un principio central en MarketScreener usted puede en cualquier momento y de forma muy sencilla solicitar la eliminación de su cuenta a través de nuestro formulario de contacto > datos personales > eliminar mis datos personales
Tan pronto como sea posible, nuestro servicio de atención al cliente se encargará de eliminar su cuenta y usted recibirá por correo electrónico la confirmación de dicha eliminación.
¿Tiene otras preguntas?
Esperamos que haya encontrado las respuestas que buscaba. Si aún tiene preguntas, no dude en contactar a nuestro servicio de atención al cliente, compuesto por personas reales, expertas en finanzas o en su área, que estarán encantadas de responder de manera cualitativa a todas sus consultas.
Hablan de nosotros
Opiniones de los usuarios
X
Xavier D. Antiguo Trader
Para un inversor fundamental, MarketScreener es una poderosa herramienta: un stock screener para encontrar los mejores valores, datos financieros y fichas de valores muy completas. El rastreador de carteras MarketScreener me da ideas sobre a quién puedo (o no) seguir, y los artículos están muy bien documentados. No podría vivir sin él.
d
dirk diggle
Tuve la increíble oportunidad de descubrir MarketScreener. Completamente neófito aprendí mucho gracias a todos los datos y a un gran equipo siempre disponible y a la escucha. Creo que es el mejor sitio de bolsa (potentes gráficos, todas las noticias, el hiperpotente stockscreener, diferentes análisis técnicos y pestañas). Gracias a Jordan, Nicolas, Eduardo, Xavier y a todo el equipo.
O
Osterman
El único medio financiero que permite contactar con profesionales que se esfuerzan por permanecer disponibles. Mis prácticas docentes han evolucionado gracias al apoyo del Sr. DUFEE y me han permitido renovar mi enfoque de la enseñanza de los mercados financieros. El uso de un medio transforma la visión tradicional de la formación de los profesionales de la figura.
R
Raphaël G. Especialista Small Caps
MarketScreener se ha convertido en LA referencia en España para la información y formación sobre la Bolsa y los mercados financieros en general. Un Bloomberg para todos
S
Scheibling
Por supuesto, estoy satisfecho con el sitio que consulto desde los años 2000. Creo que es el mejor sitio de bolsa en la actualidad y desde el año 2000, muy bien hecho (gráficos potentes, todas las noticias, los diferentes análisis técnicos y pestañas). Aprecio mucho su ayuda sobre los gráficos expertos, se tomó el tiempo para explicarme cómo configurar estos nuevos gráficos que realmente le agradezco.
C
CG
Sitio muy completo, cotizaciones en tiempo real, noticias, etc. Perfecto para seguir sus inversiones.
V
Ville44
Sitio esencial para tomar las buenas decisiones
M
Marie Lowyck
En MarketScreener encuentro la información financiera que necesito y agradezco los comentarios de cada mañana de Eduardo Quinonez y también el informe del Fondo Europa One -.
N
Nono
Buenos consejos, un buen seguimiento y personas disponibles y competentes
G
GUELLE Philippe
Un sitio serio y bien documentado. Los gráficos son fácilmente configurables.
M
Marie Josée Nom VENDITTI
Desde mi compra del consejo be semiconductor estoy satisfecho, esta empresa merece ser recomendada a largo plazo...Gracias
d
derhy
Excelente sitio de información bursátil con numerosas herramientas de ayuda a la toma de decisiones. Screeners personalizables y muy intuitivos. Ficha de valores completa y análisis sectorial de las empresas. Recomiendo encarecidamente este sitio que es imprescindible.
B
Bouroulet
Aprecio la riqueza del contenido del sitio, el screener. Las demás funcionalidades son estupendas. El resto de la información está bien presentada y cuando busques información la encontrarás.
H
Honegger
MarketScreener es hoy uno de los sitios más completos en términos de seguimiento de los mercados bursátiles. Abunda en información bursátil, los informes en pdf sobre los valores son muy completos pero yo pondría más en relieve su análisis técnicos.
P
Plasse-Fauque
Estoy muy satisfecho con el sitio MarketScreener, ¡tanta información en un solo lugar! Creo que es único, y ahorra mucho tiempo, lo cual agradezco.
G
Ginestet
Aprecio la exhaustividad de la información proporcionada; Las sesiones de presentación en vídeo me resultan muy útiles para comprender mejor las herramientas; Las opiniones dadas y las posiciones adoptadas por MarketScreener sobre los valores me parecen transparentes;
J
Jean Pierre DENYS
El sitio más extenso (quizás) de información bursátil. Una amplísima gama de empresas analizadas. Screeners que son innovaciones notablemente eficaces. Muchas felicidades.
M
Micama
Este es el único sitio que he encontrado tan completo. Si busca bien, encontrará todo lo que busca. Sólo estoy un poco decepcionado este año de que sus carteras de inversores no sean mejores... Nadie tiene una bola de cristal, ¡ni siquiera los mejores!
Trabajan con nosotros
Mensual
Anual
-20%
Access
Información y datos para inversores autónomos exigentes
Access
-17%
24
29€€/mes
24
29€€/mes
Información y datos para inversores autónomos exigentes